News

Stroud Water Research Center Resources: Model My Watershed
By: Watershed Specialist, Rachel Posavetz holding a microinvertebrate
Do you know what watershed you live in? (Click here to learn your watershed address) Where are the boundaries? Have you ever wanted to know the land use activity, average rainfall, or soil types of your neighborhood? There is now an easy way to get answers to these questions and more, readily available to anyone with internet access.
Stroud Water Research Center has developed interactive tools on their WikiWatershed® site for exploring your watershed and learning about water resources. This article will focus on an interactive mapping tool, Model My Watershed®, that allows for a search of the location and various pieces of information about the watershed in which you live. Best of all is that this resource is free to the general public.
A fun place to start is the Runoff Simulator. Learn how water behaves on a hypothetical plot of land after a rainstorm. Choose and compare land cover types such as forest or urban, soil types (C or D in most of Pike County) and rainfall amounts to see the differences in the amount of water that runs off the land, infiltrates into groundwater, and escapes into the air as water vapor. This tool can be used as a good reminder that most of our land uses have measurable impacts on how much rainwater is able to filter back into the ground versus running directly off the land to our waterways, thus potentially increasing local flooding.
What Can You Find by Using Model My Watershed ®?
Here users can find their watershed (HUC-10) and subwatershed (HUC-12), by clicking the “Get Started” button and “Select Boundary”. Another option is to select “Delineate Watershed” and click any point on the map or type in an address or place name into the “Jump to Location” box. After choosing a watershed you want to explore, the Analyze tab features 8 topic sections: Streams, Land, Soil, Terrain, Climate, Point Sources, Animals, and Water Quality. Here you will find the stats for your watershed, such as the total stream miles (with 1st Order being the smallest or headwater streams), the average elevation and slope, and whether there are permitted Waste Water Treatment Plant discharges. You can use the data from the Land and Soil sections to generate the information needed for Runoff Simulator scenarios specific to your area. You can even learn the estimated types and quantities of farm animals that live in your watershed.
There are many other data layers to explore such as mean monthly precipitation and temperature, visualizations of where the weather station data come from, locations of protected lands (parks, forests, and conservation lands), nutrient loading (for nitrogen, phosphorus, and sediment), your local topography, and boundary layers such as counties, municipalities, or school districts. Use the “Draw Area” tool to designate a given area of focus, for instance if you would like to isolate the data for just one headwater stream area, or just your community association.
Under the “Monitor” tab, you can search for available water quality monitoring data that have been archived in one of four national water quality monitoring databases. You can search these databases by topics of interest such as stream discharge, sediment, or fish.
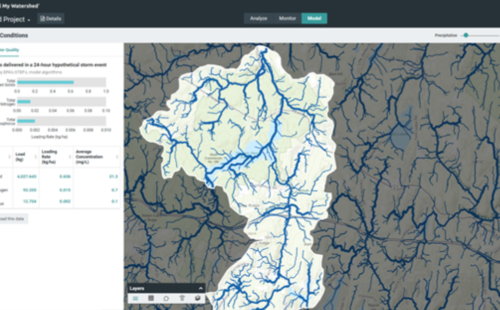
For advanced users, try exploring the “Model” tab to find out how conservation practices would impact your watershed. Users can choose to execute one of two types of water quality models to estimate how much water runs off or infiltrates to the ground within your area and estimate water quality. Each section offers the option to download the data as well.
Once you have “run” a water quality model, click “Add changes” in the upper right hand corner. Play around with the features, such as designating areas for a tree planting to see how much it will increase water infiltration into the groundwater, and decrease nitrogen and phosphorus loads into nearby waterways after a storm. The data displays in an easy-to-read color-coded graphic format to compare and contrast scenarios.
A Professional Tool with Professional Sources:
These resources are used by professionals in the conservation and land development fields to plan out the various scenarios for potential projects. While the use of the modeling data is the responsibility of the user, the information holds value in that it is derived from the best available sources and compiled by leading researchers at Stroud Water Research Center and their various partnering organizations. The data used to populate the map layers and models is sourced from reputable sources such as USGS, NOAA, USDA, etc., and is being updated as available. Pike County residents are at a great advantage because a large portion of the data used to create Model My Watershed was collected from research focused in Pennsylvania and the Northeast Mid-Atlantic Region.
Additional Uses:
Citizen Science Water Quality Data can be added into Model My Watershed (such as Leaf Pack Network) in the “Monitor My Watershed” tab or data portal. Also included in the WikiWatershed Toolkit are curricula designed for middle and high school teachers to use: https://wikiwatershed.org/curricula/.
There are many more features, layers, and tools to explore once you get comfortable with the basics. Let us know how your watershed modeling is going on our Facebook or Instagram!
Tips:
- Begin your exploration at the WikiWatershed Toolkit which houses the Runoff Simulator, Model My Watershed, and many other interactive tools.
- These resources are best viewed on a larger display, such as a computer screen/monitor.
- Be sure to select the Grid Layer “Active River Area NE Mid-Atlantic” for the best available data specific to our region.
- You may have to zoom in or out in the interactive map to see the info displayed for certain layers.
- Create a free login account to save your work and share with others.
For Help Using the Models:
- Video tutorials are available at: https://wikiwatershed.org/videos/ OR click “Help” for a page of technical documents and a contact email.
- You can follow along with this introduction video: https://www.youtube.com/watch?v=XrdjdlMBBgA&feature=youtu.be
- There is a user feedback section to let the developers know how they can make these resources most useful.
- Model My Watershed: https://wikiwatershed.org/model/
- A course on Clean Water Academy: https://pacleanwateracademy.remote-learner.net/course/view.php?id=450